Gerrymandering: Stealing Democracy from Voters
I live in North Carolina. Gerrymandering has stolen our democracy. Some people respond to gerrymandering with a yawn. Others remark that “both parties do it” or “it’s been going on forever”.
Both remarks are true, and, irrelevant. In the good old days, gerrymandering tilted the political playing field a bit. Today, with the availability of fast computers and extensive data, gerrymandering tilts the playing field dramatically.
In this post, I give a simple explanation of how gerrymandering works, using as an example the 2018 US House Race in North Carolina.
2018 US House Race in NC
Using raw data from the State Board of Elections, let’s look at the results of the November 2018 election in North Carolina’s race for US House of Representatives:
As the left graph shows, slightly more than half of the votes cast statewide went to Republican candidates and slightly less than half went to Democratic candidates.
If you think that this roughly even vote split would yield a roughly balanced seat count for the two parties across North Carolina’s 13 House districts, you’d be wrong. The right graph shows that, instead, Republicans won 10 seats and Democrats won 3 seats.
Republicans won 50.5% of the votes and 77% of the seats, making North Carolina a purple state that sends a 10-3 red delegation to the US House.
This is stolen democracy: Our members of the US House do not represent how our citizens voted. Indeed, when we dig deeper, we’ll see that most of our members, of both parties, are in “safe” districts. These districts are so dominated by voters of one party that a member can safely ignore voter opinion and expect to be reelected. That’s exactly what happened in our 2018 election: No House seat flipped party.
I want to emphasize that both Republicans and Democrats have safe districts. So, while Republicans, overall, get a huge advantage from our gerrymandered districts, and Republican politicians are the ones responsible for today’s gerrymandering, Democratic incumbents also benefit individually from being in safe districts.
The voters lose.
Let’s dig deeper to see how the gerrymandering works.
Defining Terms
First, I introduce some terminology. When I say “Democratic voter” I mean “a voter who voted for a Democratic candidate in the election being discussed.” So a Democratic voter in the election for, say, House District 3, is any voter who voted for the Democratic candidate.
A Democratic voter is not necessarily registered as a Democrat. In fact, 32% of registered voters in North Carolina are registered as unaffiliated, but many of them are Democratic voters in particular elections.
Similarly, I use the phrase “Democratic vote” to mean a vote that went to a Democratic candidate in a particular race. Likewise for "Republican voter” and “Republican vote."
Packing
Here are the vote counts by US House district:
Look at districts 1, 4, and 12. Democratic voters are packed into these districts. In other words, the boundaries of these districts were drawn to include as many Democratic voters as possible while still having an appropriate number of voters in the district.
These three districts are safe for Democratic candidates, because there are so many Democratic voters that a Republican candidate doesn’t stand a chance. On the other hand, this means that many votes for Democratic candidates are wasted in the sense that they’re just “piling on” to a pre-ordained result.
District 4, for example, had 242,002 Democratic votes, 80,546 Republican votes, and 11,947 votes for other candidates. To win, the Democratic candidate needed 80,547 votes. The remaining 161,455 Democratic votes were wasted.
In these three districts, most Democratic votes were wasted:
District 1: 57%
District 4: 67%
District 12: 63%
If those Democratic voters had not been packed into these three districts, their votes could have made a difference. Indeed, 23% of all Democratic votes statewide were wasted by packing into these three districts.
Besides the 23% of Democratic votes that were wasted, 14% of Democratic votes statewide were consumed to achieve victory in these three districts. That leaves about 63% of Democratic votes statewide to understand, which brings us to our next topic.
Cracking
Now, let’s look at how many Republican votes were wasted in the remaining districts. District 3 is an anomaly because 100% of Republican votes were wasted since there was no Democratic candidate in this year’s election. So, excluding district 3, here’s what we see:
District 2: 11%
District 5: 25%
District 6: 23%
District 7: 23%
District 8: 20%
District 9: 1%
District 10: 31%
District 11: 35%
District 13: 12%
So, a far lower percentage of Republican votes were wasted in these districts than Democratic votes were wasted in districts 1, 4, and 12.
The reason is that those 63% of Democratic voters remaining after packing, were “cracked” into these districts (plus district 3). Cracking spreads the remaining Democratic voters across districts so that in each district they are in the minority by just enough to almost guarantee a Republican victory. (Interestingly, district 9 turned out to be a bit too close for comfort.)
The Maps
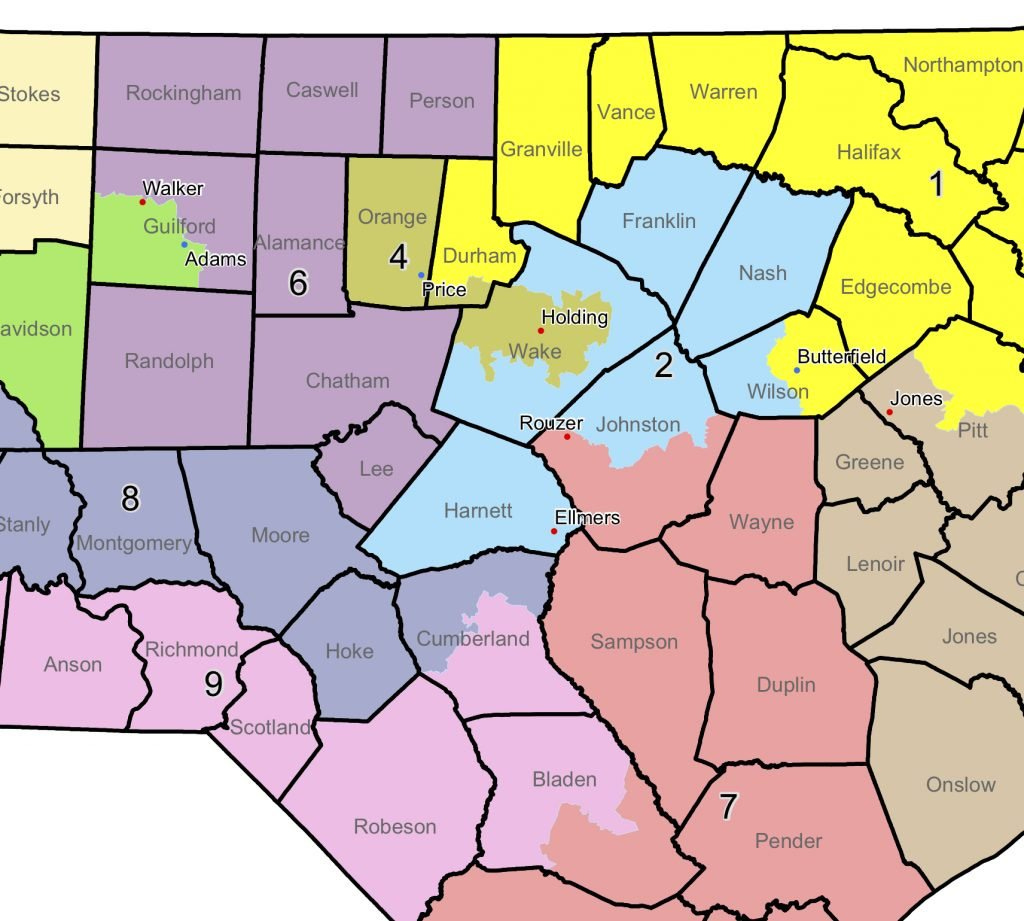
It is easy to see packing and cracking in action by looking at the district maps. You can see the whole state map, but to make it easier to see, we’ll look at a central portion of the state:
Notice that there are many “carve-outs,” oddly-shaped regions carved out of some county and joined with other counties. Of course, some counties must be split across districts to achieve equal-population districts. But it is the peculiar odd shapes that should draw our attention.
District 4
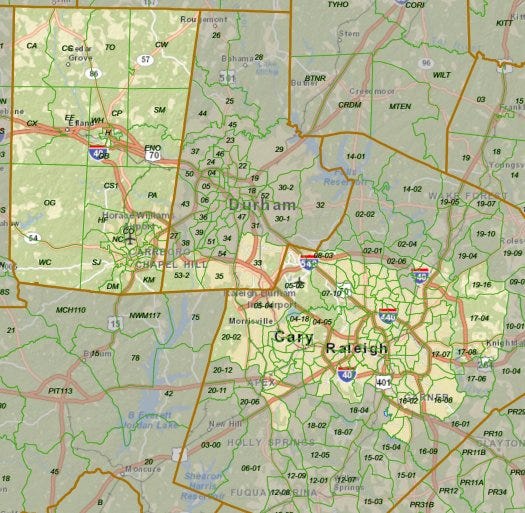
Let's start with District 4, where I live, which is one of the packed districts. Here’s a full map of the district, but we’ll zoom in on the most interesting part:
District 4 contains all of Orange County and an oddly-shaped portion of Wake County, connected together by a thin sliver of southern Durham county. Orange County votes overwhelmingly for Democratic candidates. The oddly-shaped region of Wake County contains the cities of Raleigh and Cary, both of which also vote overwhelmingly Democratic. So, District 4, by design, consumes a lot of Democratic voters.
If you live around here, or if you look at the data, you’d know that Durham County also votes overwhelmingly Democratic. So, why is District 4 constructed from Orange County and a disconnected chunk of Wake County, which is not adjacent to Orange County, when Durham and Orange Counties are adjacent?
District 1
The answer is so that almost all of the Democratic voters of Durham County can be “packed” into District 1 (yellow in the statewide map above). Again, look at a detailed district map. Here’s the full District 1 map and we’ll zoom into the most interesting parts (yellow ovals):
Durham County is densely populated compared to the other parts of District 1: It accounted for 41% of votes cast in District 1, even though it is a small part of the geographic area. The whole counties in District 1 all voted Democratic in this election, most by large margins. So, this is more packing of Democratic voters.
Why was the chunk of northern Pitt County (yellow oval at bottom right of the map above) pulled into District 1? This area is the city of Greenville, the most densely populated city in Eastern North Carolina and home of East Carolina University. It votes overwhelmingly Democratic (69% in the 2018 election). So, those Democratic voters are also being “packed” into District 1.
Districts 12 and 9
A similar analysis can be done of District 12, the other “packed” district. It is comprised of most of Mecklenburg County, which includes the highly Democratic areas surrounding Charlotte, the state’s largest and most densely populated city.
The remainder of Mecklenburg County, which is in District 9, also voted Democratic but by a much smaller margin (54% Democratic to 45% Republican). These Democratic voters were “cracked” into District 9.
Gerrymandering: Politicians Choosing Voters
With widespread availability of data about the voting habits and political beliefs of most people, computer algorithms can “pack” and “crack” to produce districts that hand elections to the party defining the districts and erect almost insurmountable barriers to the other party. This is no accident. It is politicians choosing voters, not voters choosing politicians
Indeed, the News and Observer reported in 2016 that Rep. David Lewis, a Harnett County Republican and House redistricting leader, said at a meeting that he wanted the maps drawn “to give a partisan advantage to 10 Republicans and three Democrats because I do not believe it’s possible to draw a map with 11 Republicans and two Democrats.”
If we voters want to take democracy back from the politicians, we must support non-partisan ways to draw district boundaries.


